Ganttic: The Modern Gantt-chart Tool For Your Events [Review]
Skift Take
Ganttic: What Is It?
Ganttic is a high-level planning tool for anyone that has a ton of resources to keep an eye. It can schedule projects, people, facilities, and equipment and allows you to create visual planning and scheduling using a drag-and-drop approach. The tool provides a graphical interface as well as interactive Gantt charts for real-time collaboration with an unlimited number of users. Other key features include utilization planning, reporting, and project portfolio management.
Ganttic enables you to customize exactly how your projects are organized. You can add custom data and set task duration either by time or by the effort needed. You can set task dependencies and the same task can be assigned to multiple resources at once. Tasks and projects can be grouped and filtered in a variety of ways to match your precise requirements.
##abovethefold##
Ganttic enables you to group and manage resources by location, department, roles, venues, meeting rooms, photobooths, events, furniture, rentals - anything that needs planning. It is easy to see how busy the resources are and make sure that team members are working the most efficiently.
One important thing to note is that Ganttic is a resource planning tool - not a project management tool. Although many event planners see their role as project management, there are a few good reasons why resource management offers a better approach. Traditional project planning methods assume that you are dealing with one project at a time and offers a time-limited view of one specific outcome. In reality, it is the opposite. Often as an event planner you have to handle dozens of smaller projects each day and you're tight on resources to get everything done on time and budget. For example, an event planning agency could be producing 10 events per month and have a team of six. Planning one event at a time is not realistic as different things happen at different times and you are often waiting on other people such as vendor information or client decisions. You want to be able to plan your staff time and priorities across all of the events in the pipeline to make sure that everyone is working on right tasks at the right time. To do this effectively you need clever resource planning mixed with project planning.
Event planners have long been mocked for their attachment to spreadsheets, whilst appreciating the limitations they offer when it comes to project planning. Ganttic could offer a good alternative for event planners which sits between MS Excel and MS Project. Here, at a glance, are some of the things that Ganttic offers, compared to Microsoft Excel and Microsoft Project.
Are you sitting comfortably? Let us walk you through the tool in more detail so you can see the specific usage examples for your events.
The Main Categories of Features Are:
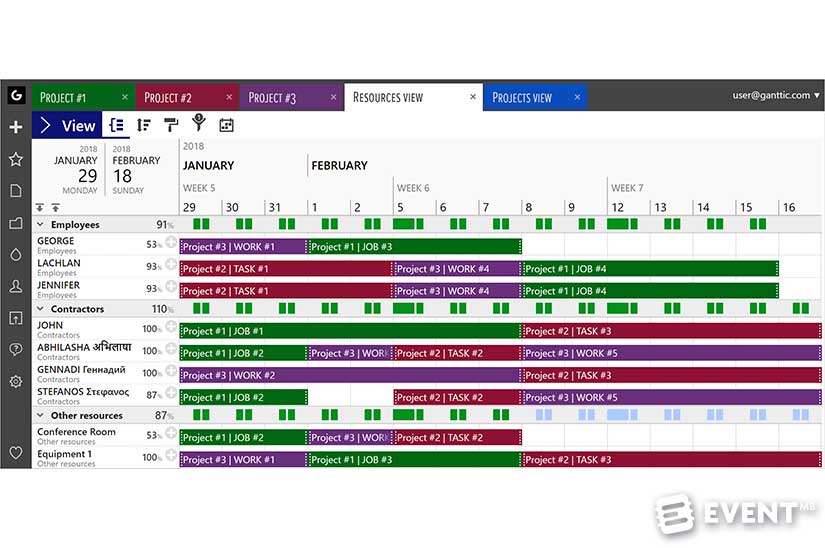
Plan Resources and Projects. Use drag and drop scheduling to create tasks, edit the details and add custom data. Manage the workload by planning by effort level required or by duration. Plan each project in separate views and have an overview using the general resource view.
Control the Workload. Easily plan different projects and concurrent tasks simultaneously and optimize resources. Use resource utilization calculations and charts to ensure that you don’t overbook.
Create Visual Reports. Filter to find the resources, tasks, and projects you need and select from all the fields to create custom reports and generate graphs to illustrate the reports.
Review
Ganttic may look complex but it is simple to get started. There are step-by-step guides and videos available and new users receive an email introduction to walk through getting set up. Only 20-25% of users need any additional support before using the tool fully, most get straight on with it. Within 10 minutes you can be set up for quick scheduling and this level of functionality works well for a lot of users. To really set up Ganttic for more complex usage though it could take a day or even up to two weeks to set everything up precisely as you need it and to get the most from what it can offer.
Resources
In Ganttic, anything or anyone that should be planned or booked in order to complete a project is a resource. That means that a resource can be each person in your team of event planners, the boardroom or meeting rooms, the company van, event props or the show laptops you rent out.
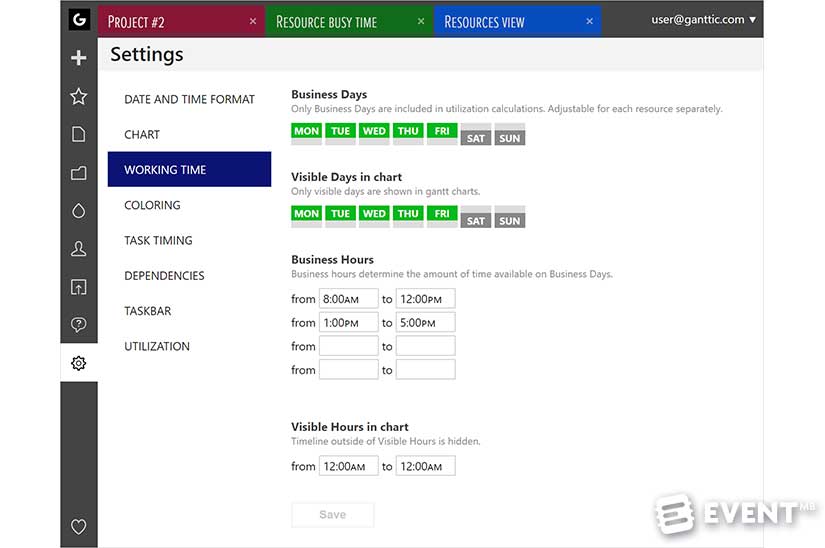
Each resource can be modified to have specific properties through custom fields and you can add a list of values, or grouping, to any resources. If your staff work different days or hours, you can set this in the worktime section. If only certain team members have a specific skill or work in a particular department, this can be noted against their profile details so that you can look up that parameter and identify those that match your requirements when you need to allocate a specific task. The data can be presented using this grouping, so you can show the workload by department if you wish, as well as against the individual.
Your Gantt-chart data can be presented in a yearly view, monthly, daily or whatever custom range you want to review. It isn’t painful to set up and add timelines into Ganttic like it can be in Excel.
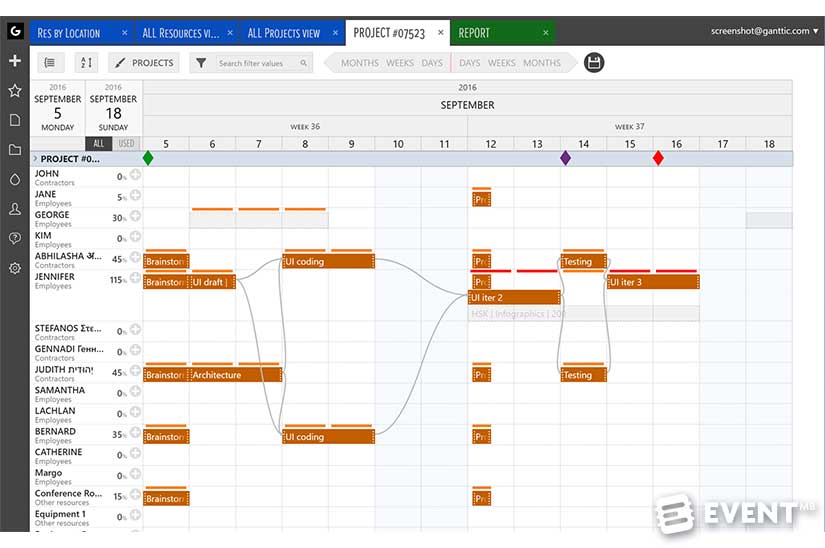
Drag-and-Drop Scheduling and Rescheduling
A task is any work or duty that needs doing by a specific resource. Add a task to the schedule by dragging the bar to the duration or time period you need, giving it a title and choosing a color. This could also be used to mark holidays or block out a period of time, such as a live event if that resource will be unavailable during that time. If plans change things can be rescheduled simply by dragging-and-dropping, you don’t have to rely on merging and unmerging cells as you would need to in Excel.
Ganttic keeps track of any changes made to tasks, projects, and resources, allowing you to view the full history. This cannot be altered or deleted, so you have full access to what has happened when you weren’t looking and any edits made to your plans.
Assign Tasks
You can set up projects and allocate tasks to each specific project, so it might work best for you to list by the event name, client or internal projects, such as a marketing campaign.
Recurring and Copying Tasks
You don’t need to keep adding recurring tasks, instead, specify how regularly the task should be repeated and for what time period or how many times it will repeat.
If you want to copy a task you just need to select “Save as Copy.” This duplicates the task but it isn’t linked to the original task, meaning that changes can be made to it without changing details of anything else.
Allocate a Task to Multiple Resources
If a task needs to be allocated to multiple resources you can select a checkbox next to all the resources involved to share the task between them. Any changes made to the task is universal and will show up for all users.
Task Dependencies
Dependencies are the relationships which determine the order in which activities need to be performed. Tasks may have multiple preceding tasks and multiple succeeding tasks. The most common dependency relationship is a finish-to-start relationship. Task P (predecessor) must be finished before task S (successor) can start. Ganttic enables you to specify the lag time gap required between the tasks to leave a specific time period between or enable the tasks to be scheduled so that the dependant task can start as soon as the first task is finished. If there is a delay on the first task being completed this moves the dependent tasks along as you can’t start on them until the earlier task is done.
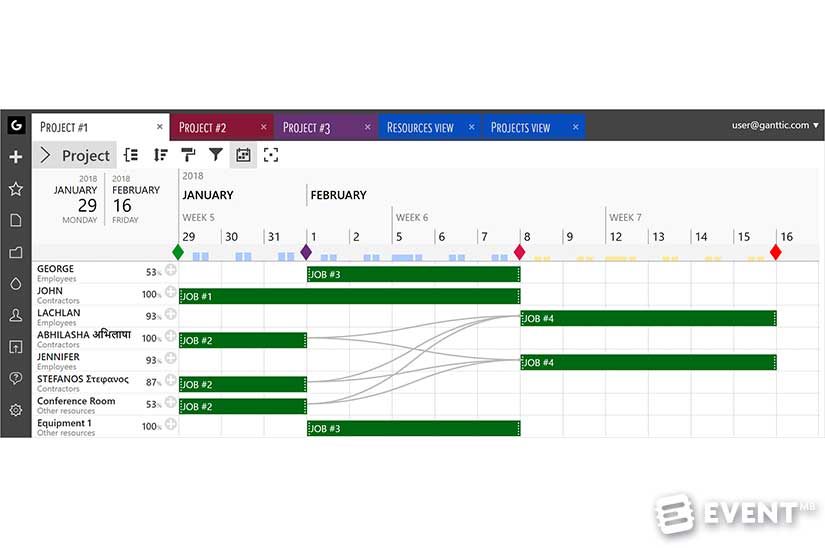
Utilization Planning
Utilization planning is one of the advanced features of Ganttic and means that you can keep an eye on resource utilization in the time period that is being displayed in the Gantt chart area and track using capacity utilization graphs for capacity planning. This is an effective way to keep your employees from overworking by giving them just enough tasks to keep motivation high and stress levels in check. You can set utilization percentage to tasks, so you can set tasks that take place simultaneously. You can choose how much attention each task needs and divide your resources' time accordingly. If one team member is over capacity you can divide some of the workload to share it with other team members, or move the tasks to a different time frame to reduce the capacity issue.
The resource utilization percentages are shown on the right of every resource's title. It shows the percentage of the available work time covered by tasks in the visible time period. If you change the length of visible time period then the utilization figure will change also.
If you group resources by projects or by custom data fields values, you can see the utilization percentage of each resource as well as each group. By doing so, you can manage the capacity utilization of each department, project, and location more effectively.
As well as coloring different tasks in different colors you can also show the utilization capacity. You can change these colors as you wish but, as default, this is set to red when someone or something is at 100% or more capacity and has a color scale shown according to the workload of each resource. Below 50% capacity is light blue as standard.
No warnings are given and it doesn’t stop additional work being given if a team member is drastically over capacity, however, a manager can see this at a glance and reallocate tasks accordingly.

Time Tracking
You can add custom data, such as the hourly rate of the staff member, their project manager, and status of a project. Time tracking against a project is useful to track how long it actually took and help to make better calculations in the future. It can give a cost estimation for each task so that you can compare the budgeted time against the agreed fee.
Syncing to Google Calendar
You can synchronize plans between Google Calendar and Ganttic. This means that you can keep your staff updated and manage your team without them needing to sign in to Ganttic.
Automatic syncing works in both directions - a new event will appear automatically in Ganttic when you create it in Google Calendar. Similarly, a new task will appear automatically in Google Calendar when you create it in Ganttic. Two-way sync works with task titles only. One-way sync means that if you add a project name, task custom field or notes related data in Google Calendar, it won't be exported to Ganttic but it works the other round.
Syncing to Outlook Calendar
Outlook Calendar will create new tasks in Ganttic and vice versa. Compared to Google Calendar synchronization, there are no one-way or two-way or project title and data field sync options. Only event titles, times and dates are synchronized. Meeting invitations that are added to Outlook as calendar entries are not synchronized. Note that the sync feature only works with online Office 365 email accounts. MS Exchange support is currently disabled.
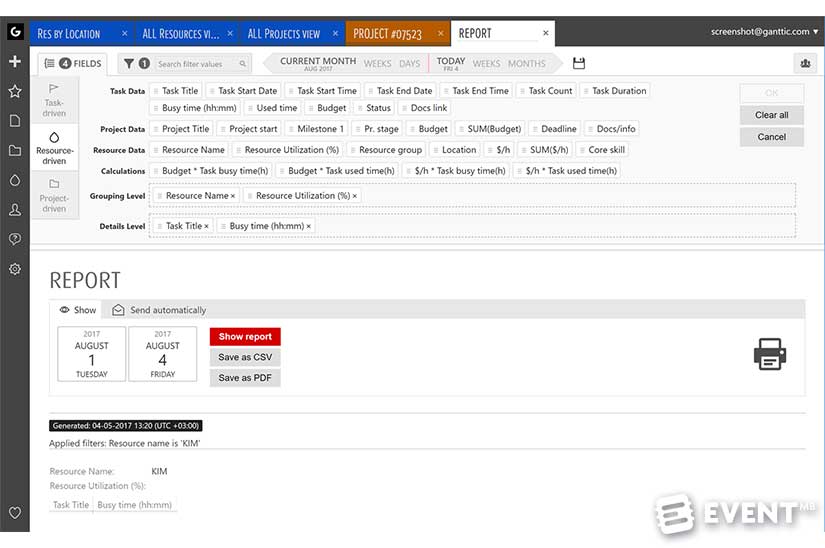
Reports
Reporting is important and Ganttic offers three types of reports: task-, project-, and resource-driven. If you choose a resource-driven report, even the resources that don't have any tasks during the time period you have selected, are displayed in the report. You can automatically generate reports monthly, weekly or as needed based on a variety of metrics.
Using reports, you can have an overview of all the tasks, track budget, calculate the difference between the task duration and used time etc. Basically, any information you have in Ganttic, you can use to create reports.
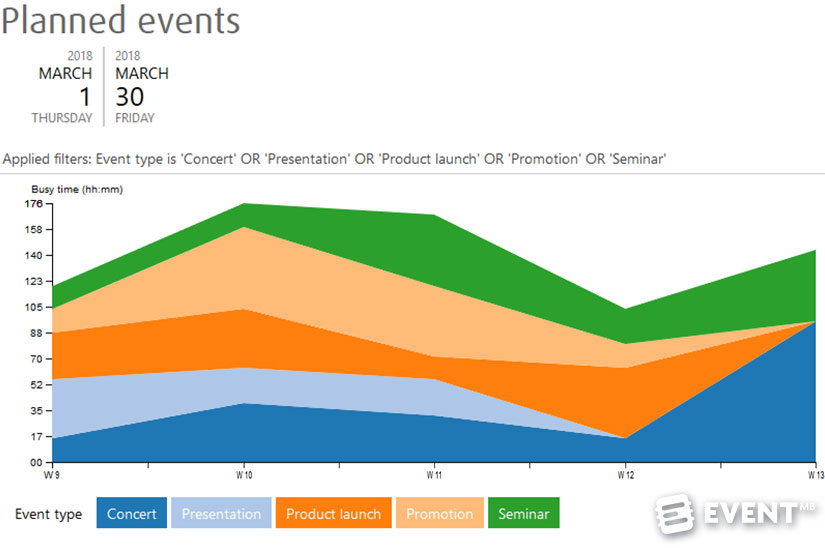
A newly launched feature is for visual reports. This means that you can bring the data to life by choosing the chart type, naming your chart, and choose if it’s a private or public chart (meaning only you can access it or your whole team can see it). You can create line, bar, stacked bar, and area type charts to suit your data and what you’d like to see.
Reports offer an overview of a specific part of the resource plan and are handy to report to upper management or to make financial decisions. As a manager, you can decide if the department or the team can take on a new project or if that would be impossible at the current time. You can see if you need to take on new resources to optimize the workload. You can see where and when tasks need to be reallocated.
Since the charts are generated based on your data, you can generate charts using fixed fields like project title and busy time or any custom data fields you have added. If you choose the latter, you can create charts based on task or project statuses, you can generate charts to have an overview of the workload of a specific manager or the usage of different rooms or equipment.
User Permissions
Admins can set what each team member can see and do. You can specify if they can edit, add projects, move project timelines or view only. If they do have permissions to edit, you can see the changes made and find out those that are putting off tasks or holding up progress. Resource-based rights mean that users can only see certain elements and not rest of timeline or the workload of other staff members or specific projects unless you want them to.
Mobile App
Ganttic is mobile friendly. Mobile apps are available for iOS and Android, however, the app is made for staff to check their tasks for the day, week or month rather than to update on the go.
Features
Plan Resources and Projects
- Customizable resource, task, and project details to fit your data
- Specify working time and timezones
- Save time communicating with team members
- Dynamic and customizable resource grouping/filtering to group resources according to your needs
- Set a task by effort level required, or by duration
- Instant filtering of projects, tasks, and resources by any data
- Conditional coloring of taskbars - color tasks and projects to meet your needs
- Drag and drop scheduling
- Multi-resource tasks
Control the Workload
- Project portfolio planning
- Save your budget by allocating unused resources
- Easily plan different projects simultaneously
- Resource utilization calculations and charts to ensure that you don’t overbook and optimize what is available
- Set concurrent tasks, utilization and control the priorities
- Resources can be synced with Google Calendar and MS Outlook
- Resource scheduling
- Multi-user interface
- Control who can see, and edit, what
Create Visual Reports
- Filter to find the resources, tasks, and projects you need
- Select from all the fields to create custom reports
- Customizable reports
- Custom set data fields
- Save to PDF or CSV
- Automate daily, weekly or monthly reports
- Choose the chart type, name your chart, and decide if it’s a private or public chart (only you can access it or for your whole team to see).
- Create line, bar, stacked bar, and area type charts.
- Specify the time period
Who Is It For?
Ganttic is used across many different sectors all over the world, including services (32%), engineering (14%), software development (11%), manufacturing (9%) and creative services (8%).
In the event management industry, managers and anyone in charge of planning the general workflow will find Ganttic useful. This includes not only those planning events but also those that are involved in event rentals, venue hire, meeting room bookings and so forth.
Pros and Cons
Pros
- Free up to 10 resources
- A good alternative between spreadsheets and Microsoft Project, concentrating on resources and giving a visual overview of everything in a Gantt chart style
- You can build different views, groupings and custom data fields then filter out everything to create the charts and reports you need
- Utilization planning – by numbers and with colors – you can easily see who is overbooked.
Cons
- Does not have an API
- Not meant for traditional project planning - it focuses on resource planning
- You cannot create subtasks
- There is no undo button
Pricing and Plans
Ganttic has a resource, not user-based pricing and is completely free for up to 10 resources. A resource could be a member of staff, a meeting room or a photobooth.
Paid plans start at $25 per month or $250 per year.
A 14-day free trial is available to test the full features (no credit card required).
Click here for the full pricing information.

In Conclusion
If you want to manage your resources more effectively to help you plan better and make informed decisions Ganttic is definitely worth exploring. You can create a simple overview which is free for up to ten resources, or spend a little bit of time to customize more complex processes and requirements to your needs. Whether you are planning events, renting out event equipment or coordinating room bookings this could be just the solution you need to implement to ditch those painful spreadsheets.
Disclaimer: Reviews are paid for placements. While Event Manager Blog receives a fee to extensively look at the tool and review it in detail, the content of the review is independent and by no means influenced by the company. If you have any questions please use the contact us section.
Up Next
Wordly Live AI Translation and Captioning [Review]

Zenus AI Badge Scanning and Facial Analysis [Review]
MeetMatch Networking Software and Event App [Review]
Cvent Vendor Marketplace [Review]